Miami real estate is well known for its boom-and-bust cycles of growth. This is a metropolitan area notorious for wild land speculation, for disreputable hucksters selling naive Northerners plots of the Everglades that are still underwater, and for calamitous real estate collapses when the next hurricane hits or foreign capital dries up. Each boom also leaves a distinct architectural layer on the city, making them readily observable to the trained eye. Gridics data breaks down these trends, both architectural and market, in fascinating detail.
Miami real estate is well known for its boom-and-bust cycles of growth. This is a metropolitan area notorious for wild land speculation, for disreputable hucksters selling naive Northerners plots of the Everglades that are still underwater, and for calamitous real estate collapses when the next hurricane hits or foreign capital dries up. Each boom also leaves a distinct architectural layer on the city, making them readily observable to the trained eye. Gridics data breaks down these trends, both architectural and market, in fascinating detail.
The history of Miami’s development begins a little more than a century ago. Most buildings from the legendary boom of the 1920s are Mediterranean Revival. The 1930s brought us Art Deco and Med Deco. Late deco came in the late ’40s, merging into the iconic MiMo — or Miami Modern — of the ’50s and ’60s, and even the early ’70s, an extended period of incredible growth. Postmodernism (picture the Atlantis Condominium on Brickell Avenue or the Pink House in Miami Shores, both by Arquitectonica) blossomed in the real estate boom of the ’80s. Finally the great condo boom of the 2000s brought us contemporary white towers with glass railings and floor-to-ceiling windows, atop giant amenity-decked podiums, practically everywhere.
Real estate experts always say each crash will be the last. But is Miami’s pattern really changing? As a city, we may be growing up, but does that mean we’re stabilizing? Or, like other aspects of Miami culture, is our economy — specifically our real estate economy — as wild as ever?
This is a metropolitan area notorious for wild land speculation, for disreputable hucksters selling naive Northerners plots of the Everglades that are still underwater, and for calamitous real estate collapses when the next hurricane hits or foreign capital dries up.
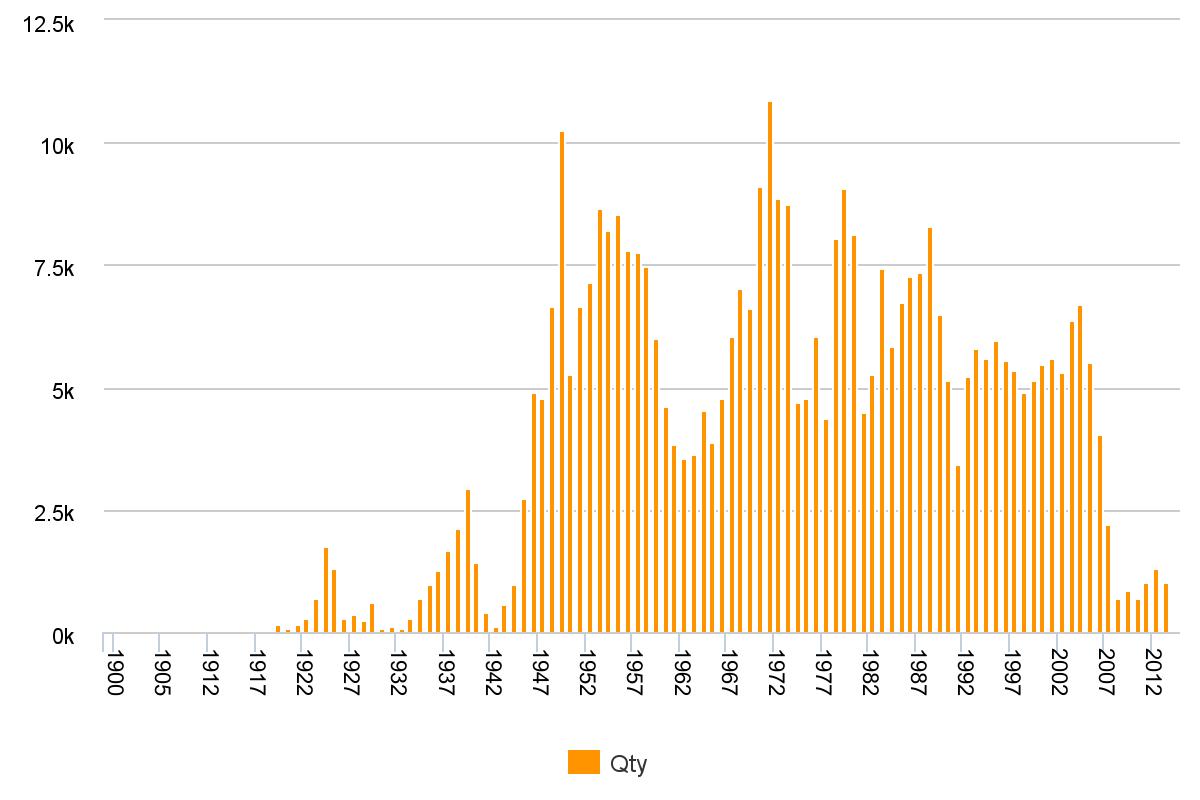
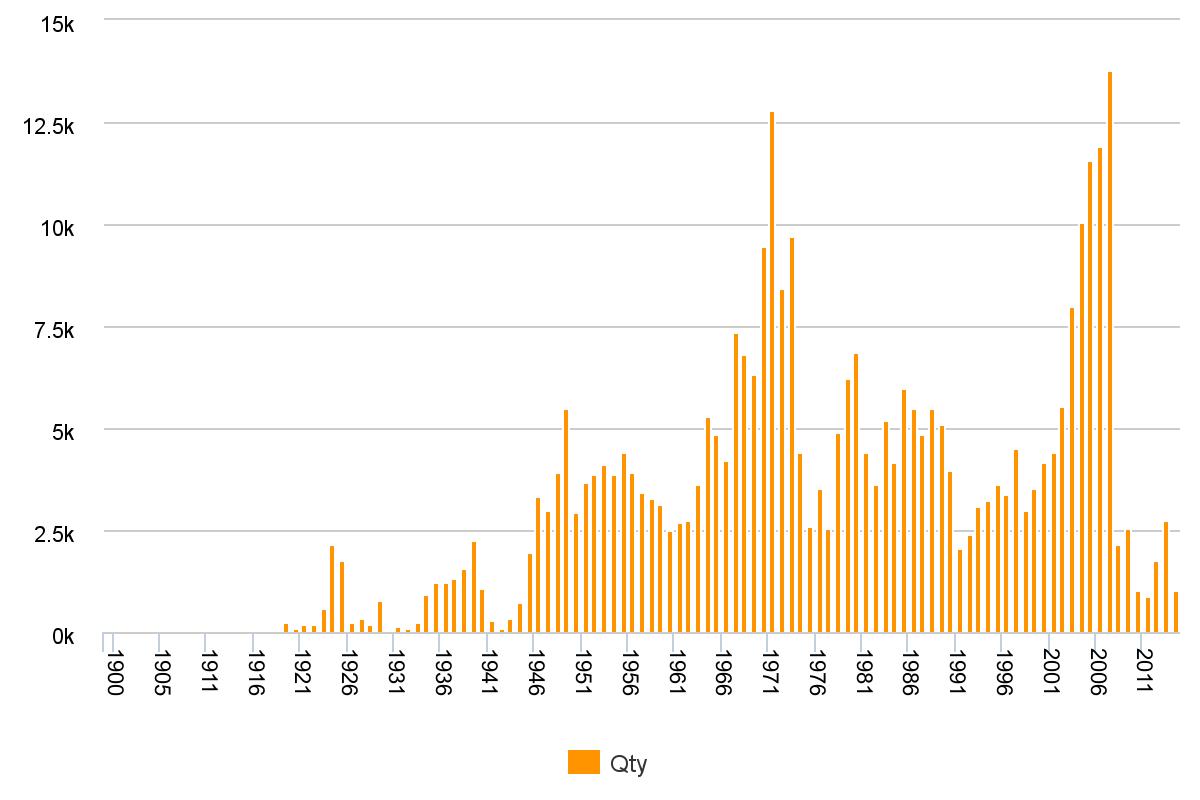
Two of the best ways to look at Miami’s growth over time are total property records and square footages of all development, with data from Miami-Dade Property Records. Of course, no data set is perfect, and neither accounts for buildings demolished and replaced with other structures, because their property records are erased. In the residential sector, data is skewed toward individually owned condominium units over apartments, as each condo has its own record whereas an entire apartment building only counts as one. Square footages also change depending on the different ways people live, both at home, work, and otherwise, through time. A single family home generally has a larger square footage than a condo, and an enclosed mall may take more interior space than a retail street or open-air plaza. Note also that numbers from 2015 are artificially low because the Miami-Dade Property Appraiser hasn’t yet recorded all their data for the year.
As we can see from this graph, a comparatively few number of properties were developed in (or at least survive from) the roaring ’20s. Even though the ‘big bubble’ as it was called is remembered as a boom of legendary scale, Miami was a small town back then, when eight and ten story hotels were considered skyscrapers. Then the ’30s came, and as the rest of the country was still wallowing in the Depression, art deco hotels and apartment houses were being built up and down Miami Beach. Everything almost stopped for a few years during World War II. The 1940s and ’50s, with the advent of air conditioning, suburbanization, the construction of new highways, new mega hotels like the Fontainebleau, and entire suburban cities popping up from scratch, Miami-Dade County experienced a consistent and massive period of growth that lasted for a good 15 years.
Construction slowed somewhat in the mid-’60s, experienced a radical peek in the early ’70s, perhaps due to additional suburban construction and the introduction of condo towers in various parts of the county. Even in the ‘bad old days’ of the 1970s, with cocaine and crime rampant, construction kept up, leveling out a bit in the early 1990s, before the beginning of one of the greatest booms yet: the condo boom of the 2000s. Then in 2008 Miami hit the biggest real estate crash of its history, a crash from which, even in today’s high flying real estate market of multi-million dollar apartments, most of the county is only beginning to recover.
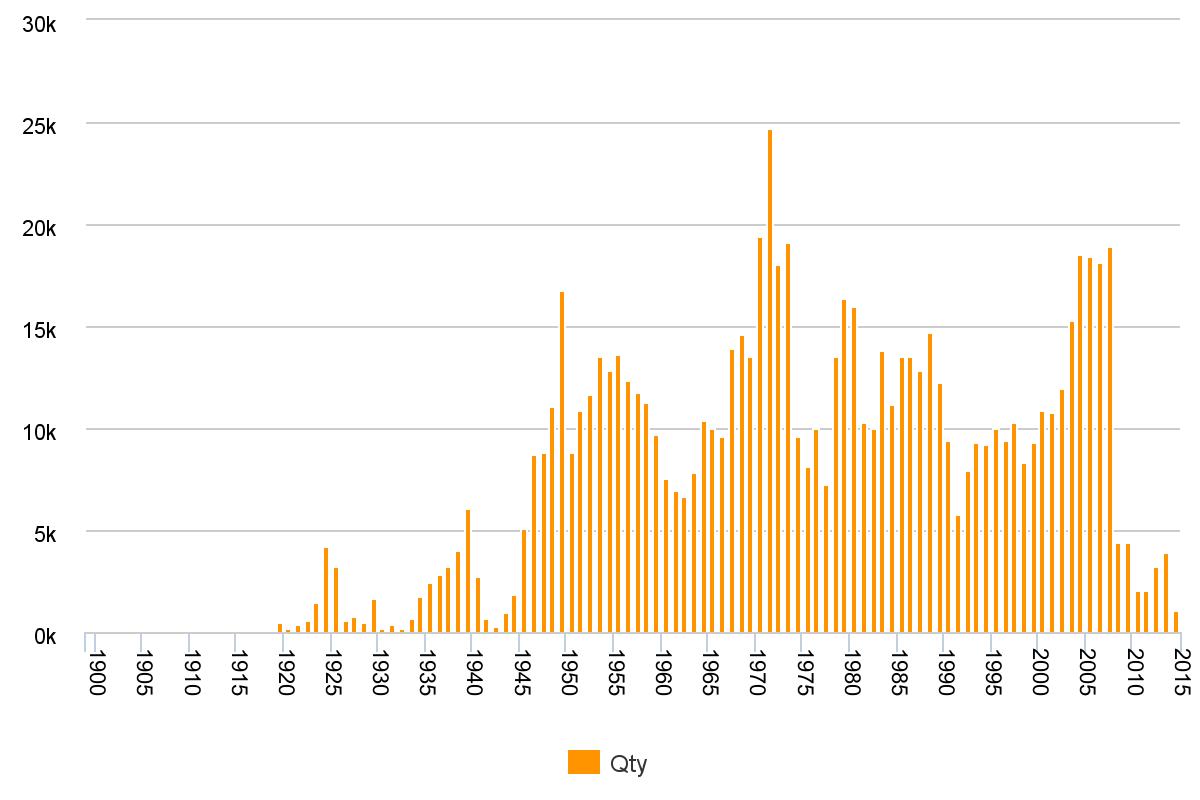
Total Square Footage by Year Built
A graph of total square footage built per year tells a somewhat more balanced, but slightly different story, specifically of the last five or ten years. According to this dataset, the real estate crash of 2008, although still bad, was not quite as calamitous for construction as in the first graph. Even in the depths of the Great Recession, 11 million square feet of space was still built, which is about the same amount that survives from the wildest year of the great 1920s boom.
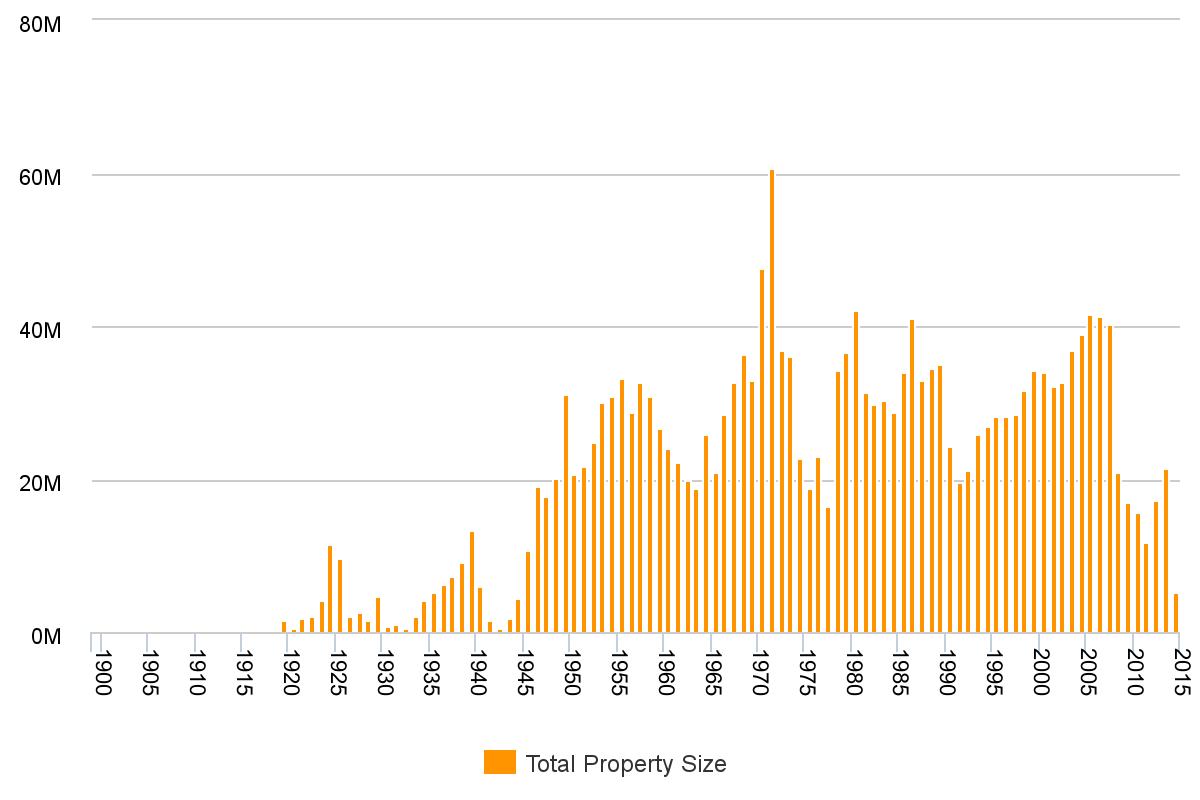
Average Residential Property Size by Year
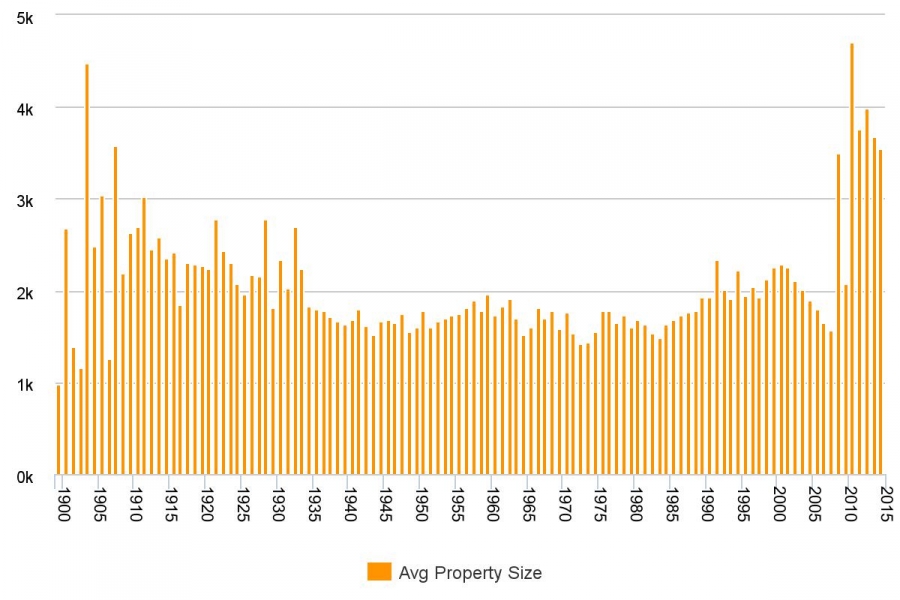
Going from the bigger picture into finer-grained details, looking at the average residential property size by year, we see the numbers remain remarkably consistent, except in the very earliest days of Miami’s history and the most recent. In the very early 1900s, average residential property size was all over the place, probably due to a few factors, including the very small sample size, the fact that at that time Miami had enclaves of very wealthy people building enormous houses (this was around the era that homes like Vizcaya, and the Deering Estate were built), and that those large houses were much more likely to survive to the present day than their small counterparts. Remember that demolished buildings are not counted.
The trend gradually levels out, and by 1935 the average home size remains very, very steady at just under 2000 square feet, dipping to about 1500 at times, and 2,250 at others. Finally, in a radical shift, the average size of completed new residential units rockets to 3,900 square feet in 2009 and and astronomical 4,700 square feet in 2011, with that number staying just under 4,000 square feet until today. A key factor here is increased number of apartment buildings built after the crash of 2008, but it also has to do with the shift toward larger units for the wealthy. Today’s real estate market is tipped significantly toward the very wealthy who typically want larger homes, with these numbers clearly showing it.
Residential Properties Not Homestead Exempted by Year
Gridics data, of course, is best applied to the current market. Here let’s look at the Homestead Exemption tax break, and who takes advantage of it. How many residential properties are owned as a primary residence, and how many as secondary or investor, and which properties do end-users prefer as opposed to investors? One way to measure that breakdown is by looking at which properties take advantage of the Homestead Tax Exemption, which can only be used toward one’s primary residence. Looking at the first graph above, people not taking a homestead exemption by far prefer properties built in the real estate cycle of the 2000s, when thousands of units which are still relatively new flooded the market, and properties built in the late ’60s and early ’70s, which includes much of the condominium stock in places like Mid-Beach and Aventura. On the other hand, looking at the last chart, below, residential properties taking a Homestead Exemption are much more evenly distributed among properties built after World War II. People that actually live in Miami (as opposed to investors, who like ‘new’) have much broader tastes in housing.
Residential Properties Homestead Exempted by Year